
advertisements
Tracking the Stock Market
with Astrology
by Michael O'Reilly
Anyone who's done some trading in the stock market knows that stock prices tend to move in cycles.
Prices go up, prices go down, and then back up again. As the old saying goes, if you want to make money in the stock market, buy low and sell high. But it's easier said then done. Recent studies on investor behavior show that most independent investors or investment groups tend to follow the herd. They see a potential great stock pick in the news or hear about it from a credible source, and then
Astrology, as the study of cycles, would seem to be a valuable tool to better understand individual stocks and market movements.
The problem here is that financial cycles are complex, with many variables moving markets in unpredictable ways. However, by using a company's First Trade chart, the individual investor has a good road map for tracking unusual price movements. And once the First Trade chart proves its worth, one can also make a forecast in price direction and magnitude. This is where astrology can be extremely profitable.
buy it, not knowing that other shrewd investors are doing exactly the same thing across the country. Most investors like this end up buying high and selling low.
Charting the Financial Trends
When the overall market conditions are trending up, it's not uncommon to find several companies among the day's top gainers that have doubled in price in one day. However, the vast majority of stocks tend to rise when the overall market is rising and fall when the trend is heading down. Financial astrologers know that around 75 percent of a stock's price movement can be directly attributed to the market trend. So for investors who are in for the longer term, knowing a stock's First Trade chart is generally not as important as knowing the market's direction.
Those who have researched the planetary indicators and charts that might foretell market trends are not in agreement. Some financial astrologers have provided a set of rules to guide investors. For example, when Saturn is in Cancer, the market trends down. Or when the Lunar Nodes are in Aquarius, markets are bearish, and when the Nodes are in Leo, markets reach a peak.
Other financial astrologers look at the planetary aspects and stations, and say that they can judge whether or not to invest based on these indicators. A classic case is that markets tend to reverse direction when Venus turns retrograde. In the broadest sense, the markets will come under pressure when the outer planets form hard aspects to each other. Most agree that Saturn-Uranus conjunctions, squares and oppositions mark times when the stock markets will turn bearish. Critical turning points also correspond to the Jupiter-Saturn cycle. Not much consensus can be found for other combinations, or if Neptune and Pluto have any role at all. The trend-setting outer plant combinations generally feature combinations of Jupiter, Saturn and Uranus.
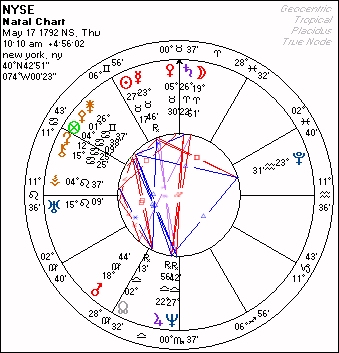
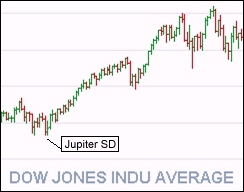
Still another branch of financial astrology uses market horoscopes to track stock prices and trends. Among the most popular are the charts for the New York Stock Exchange and the Dow Jones Industrial Averages. Here too astrologers are mired in uncertainty since the exact time and dates for these are not known. The NYSE was founded on May 17, 1792 on Wall Street – that much is for sure. Among the most popular rectified times is 10:10 am, a time that works quite well in practice, and the one used in this article.
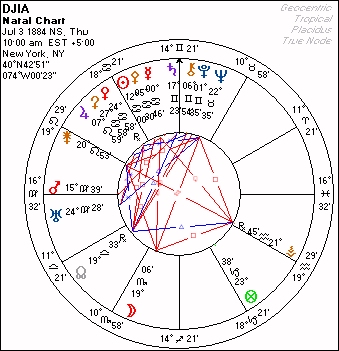
The DJIA was created on May 26, 1896, but its predecessor, the Dow Jones Transportation Averages, was started on July 3, 1884 and this one is the most commonly used, with a birth time of 10:00 am (New York City). While the 1884 DJIA chart does have some strong connections with major market tops and bottoms, for simplicity, I use the NYSE chart, which covers the broadest market and has the oldest pedigree. Astrology-minded investors are encouraged to compare these various horoscopes and see for themselves which one best tracks market trends and reversals.
Most financial astrologers will tell you that having an accurate market horoscope is not enough, especially during extraordinary times like recessions, booms, natural disasters, presidential assassinations and other events that might weigh on market psychology but that are not directly related to the business cycle. And in our increasingly global economy, conditions in far-off places like Dubai or Argentina can have a sudden and unexpected influence over American stock prices. The occasional wild gyrations in oil prices periodically upset the balance sheets, and tracking Neptune's aspects to other outer planets doesn't reveal when this might happen. Ultimately, one realizes that financial astrology is one of the most complex and difficult disciplines one can undertake. But since the potential rewards are great, we carry on.
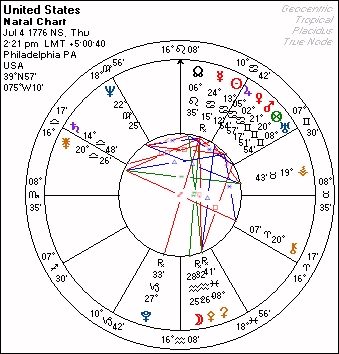
Probably most influences outside the NYSE horoscope and the planetary cycles can best be tracked by using the U.S. national horoscope. I'm often asked why I use the Scorpio Rising chart (set for 2:21 pm; July 4, 1776; Philadelphia), and frankly, the original value of this horoscope was realized when I first began analyzing market trends. Initially I used the still-popular Gemini Rising chart, but this one just didn't fit the market's most important turning points, such as the October 28, 1929 crash, or the next big crash on October 19, 1987. The Sagittarius Rising horoscope (the so-called Sibley chart) didn't work much better, especially when using the progressed Midheaven and Ascendant. Finally, when I tried Mark Penfield's Scorpio Rising horoscope, everything fell into place. For more info, see U.S. Scorpio Rising
What astrological factors influence market trends and turning points? Here's an excerpt from the full length article featured in Dell Horoscope magazine's May 2010 issue. More later...
NeptuneCafe presents

Advertise on this site.
For more info, email wolfstar@neptunecafe.com
this article continues...
Part Two - The March 6, 2009 V-Shaped Bottom
Part Three - the U.S. horoscope's role
Part Four - Blending Planetary Cycles